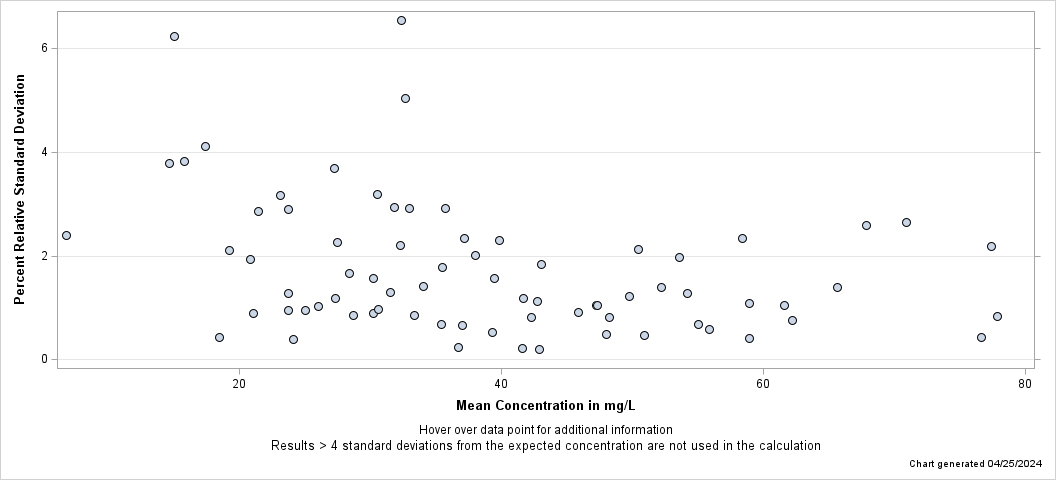
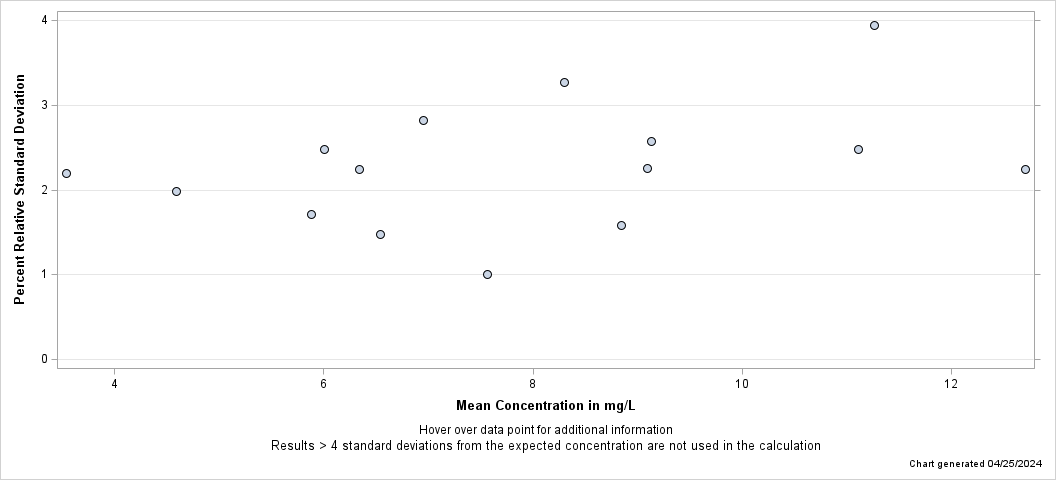
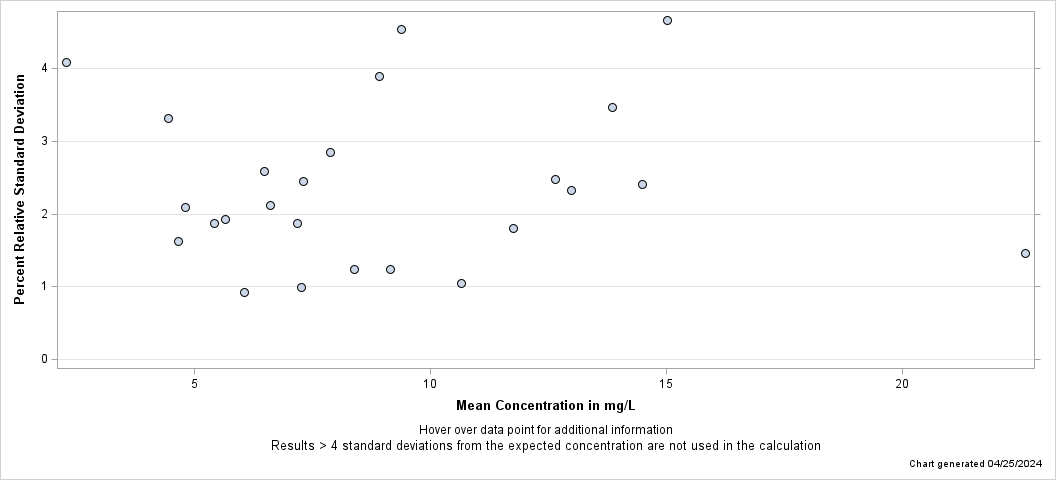
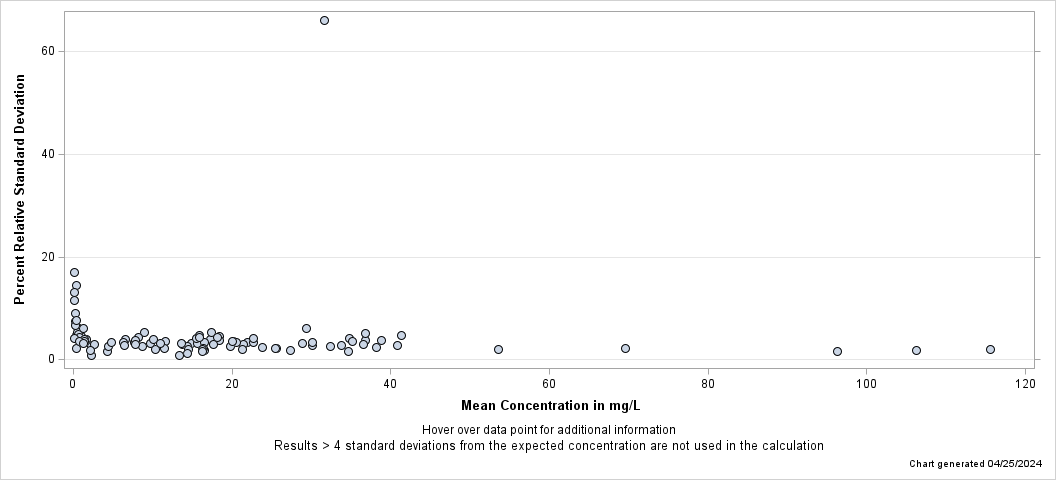
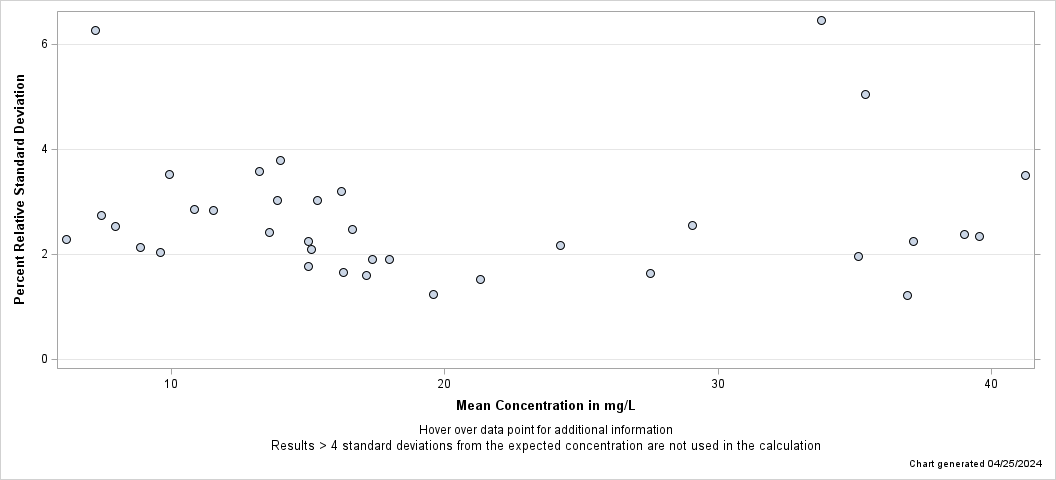
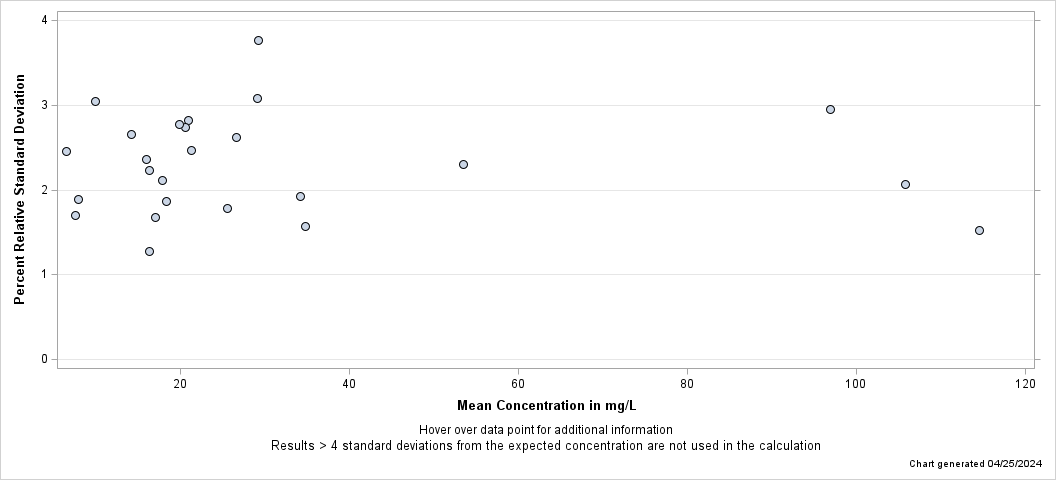
- ANC as CaCO3, water, unfltd, fixed EP (pH 4.5) titr, lab -
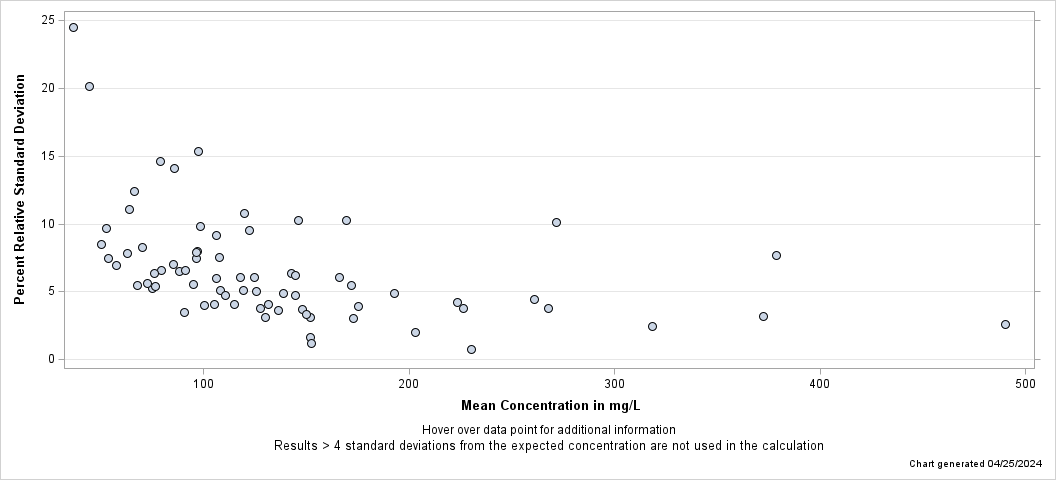
Percent Relative Standard Deviation
Lab: NWQL, PCode: 90410, MCode: TT040
Dates: 10/23/18 through 10/22/24
Open Data Set

 Mean = 59.42 
 % Relative Standard Deviation = 2.4 
 Number of Observations = 5 
 Blind Sample ID = M244  Mean = 41.02 
 % Relative Standard Deviation = 1.2 
 Number of Observations = 5 
 Blind Sample ID = M242  Mean = 27.56 
 % Relative Standard Deviation = 3.0 
 Number of Observations = 8 
 Blind Sample ID = M240  Mean = 60.04 
 % Relative Standard Deviation = 1.4 
 Number of Observations = 7 
 Blind Sample ID = M238  Mean = 17.59 
 % Relative Standard Deviation = 3.5 
 Number of Observations = 10 
 Blind Sample ID = M236  Mean = 35.64 
 % Relative Standard Deviation = 2.8 
 Number of Observations = 9 
 Blind Sample ID = M234  Mean = 14.63 
 % Relative Standard Deviation = 3.8 
 Number of Observations = 9 
 Blind Sample ID = M232  Mean = 52.19 
 % Relative Standard Deviation = 1.4 
 Number of Observations = 9 
 Blind Sample ID = M230  Mean = 35.52 
 % Relative Standard Deviation = 1.8 
 Number of Observations = 10 
 Blind Sample ID = M228  Mean = 50.47 
 % Relative Standard Deviation = 2.1 
 Number of Observations = 10 
 Blind Sample ID = M226  Mean = 23.76 
 % Relative Standard Deviation = 2.9 
 Number of Observations = 11 
 Blind Sample ID = M224  Mean = 58.41 
 % Relative Standard Deviation = 2.3 
 Number of Observations = 11 
 Blind Sample ID = M222  Mean = 53.43 
 % Relative Standard Deviation = 2.4 
 Number of Observations = 7 
 Blind Sample ID = M220  Mean = 29.98 
 % Relative Standard Deviation = 1.3 
 Number of Observations = 7 
 Blind Sample ID = M218  Mean = 41.42 
 % Relative Standard Deviation = 0.2 
 Number of Observations = 4 
 Blind Sample ID = M214
The SGPlot Procedure


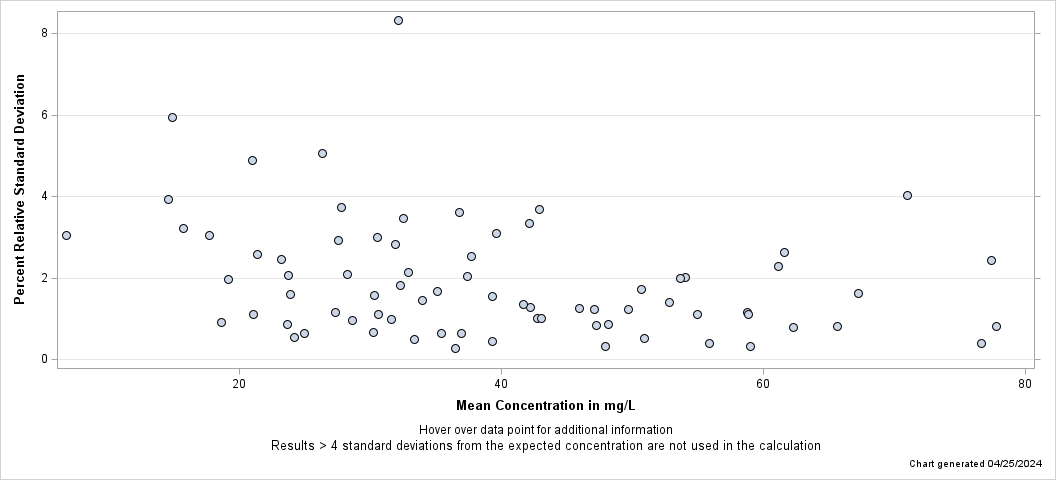
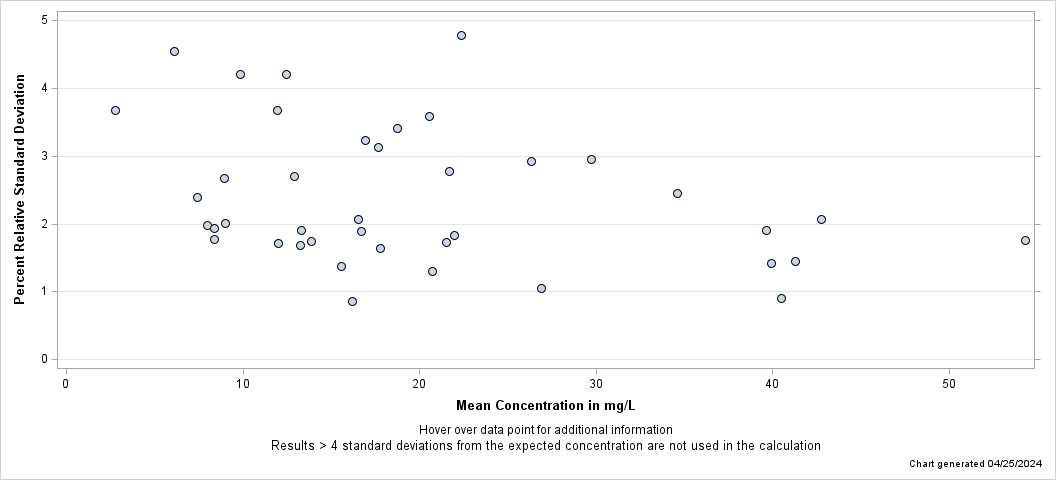
- Alkalinity as CaCO3, water, fltd, fixed EP (pH 4.5) titr, lab -
Percent Relative Standard Deviation
Lab: NWQL, PCode: 29801, MCode: TT040
Dates: 10/19/18 through 10/16/24
Open Data Set

 Mean = 59.14 
 % Relative Standard Deviation = 2.0 
 Number of Observations = 7 
 Blind Sample ID = M244  Mean = 41.27 
 % Relative Standard Deviation = 1.2 
 Number of Observations = 9 
 Blind Sample ID = M242  Mean = 27.87 
 % Relative Standard Deviation = 2.9 
 Number of Observations = 12 
 Blind Sample ID = M240  Mean = 60.59 
 % Relative Standard Deviation = 3.1 
 Number of Observations = 15 
 Blind Sample ID = M238  Mean = 17.94 
 % Relative Standard Deviation = 3.3 
 Number of Observations = 14 
 Blind Sample ID = M236  Mean = 36.57 
 % Relative Standard Deviation = 3.6 
 Number of Observations = 19 
 Blind Sample ID = M234  Mean = 14.94 
 % Relative Standard Deviation = 5.9 
 Number of Observations = 13 
 Blind Sample ID = M232  Mean = 52.80 
 % Relative Standard Deviation = 1.4 
 Number of Observations = 19 
 Blind Sample ID = M230  Mean = 35.16 
 % Relative Standard Deviation = 1.7 
 Number of Observations = 14 
 Blind Sample ID = M228  Mean = 50.71 
 % Relative Standard Deviation = 1.7 
 Number of Observations = 20 
 Blind Sample ID = M226  Mean = 23.91 
 % Relative Standard Deviation = 1.6 
 Number of Observations = 18 
 Blind Sample ID = M224  Mean = 58.89 
 % Relative Standard Deviation = 1.1 
 Number of Observations = 23 
 Blind Sample ID = M222  Mean = 53.62 
 % Relative Standard Deviation = 2.4 
 Number of Observations = 11 
 Blind Sample ID = M220  Mean = 30.29 
 % Relative Standard Deviation = 1.9 
 Number of Observations = 15 
 Blind Sample ID = M218  Mean = 30.75 
 % Relative Standard Deviation = 0.6 
 Number of Observations = 4 
 Blind Sample ID = M216  Mean = 41.79 
 % Relative Standard Deviation = 1.9 
 Number of Observations = 8 
 Blind Sample ID = M214
The SGPlot Procedure


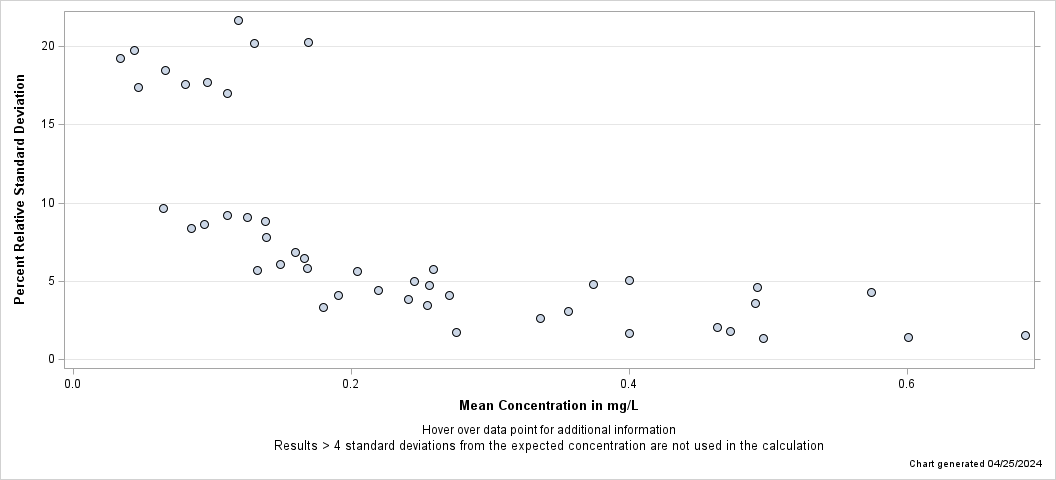
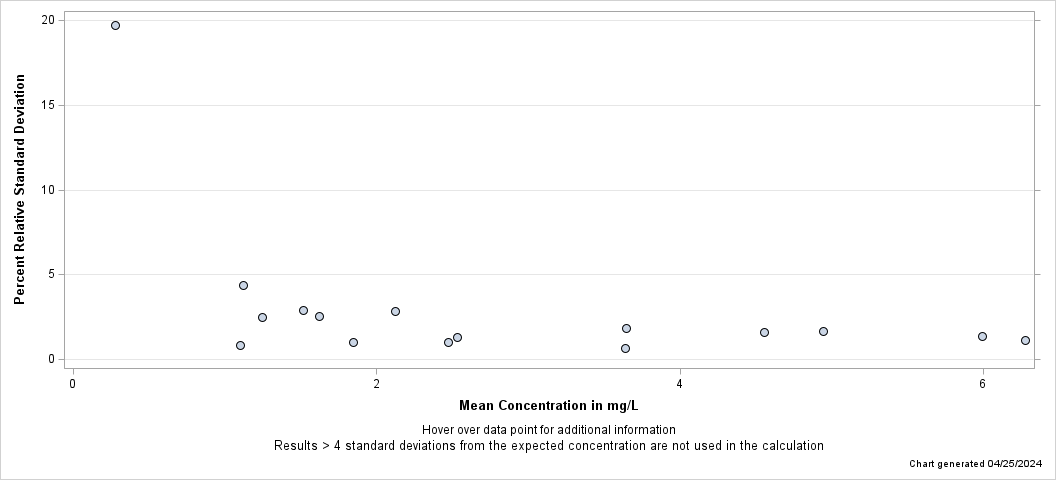
- Bromide, fltd, IC -
Percent Relative Standard Deviation
Lab: NWQL, PCode: 71870, MCode: IC027
Dates: 11/20/18 through 11/06/24
Open Data Set

 Mean = 0.51 
 % Relative Standard Deviation = 10.7 
 Number of Observations = 9 
 Blind Sample ID = M242  Mean = 0.26 
 % Relative Standard Deviation = 3.3 
 Number of Observations = 10 
 Blind Sample ID = M240  Mean = 0.61 
 % Relative Standard Deviation = 6.7 
 Number of Observations = 15 
 Blind Sample ID = M238  Mean = 0.16 
 % Relative Standard Deviation = 7.3 
 Number of Observations = 17 
 Blind Sample ID = M236  Mean = 0.11 
 % Relative Standard Deviation = 8.3 
 Number of Observations = 24 
 Blind Sample ID = M234  Mean = 0.40 
 % Relative Standard Deviation = 5.1 
 Number of Observations = 17 
 Blind Sample ID = M232  Mean = 0.03 
 % Relative Standard Deviation = 19.2 
 Number of Observations = 24 
 Blind Sample ID = M230  Mean = 0.17 
 % Relative Standard Deviation = 20.3 
 Number of Observations = 18 
 Blind Sample ID = M228  Mean = 0.04 
 % Relative Standard Deviation = 19.8 
 Number of Observations = 24 
 Blind Sample ID = M226  Mean = 0.25 
 % Relative Standard Deviation = 5.0 
 Number of Observations = 17 
 Blind Sample ID = M224  Mean = 0.08 
 % Relative Standard Deviation = 8.4 
 Number of Observations = 23 
 Blind Sample ID = M222  Mean = 0.22 
 % Relative Standard Deviation = 5.2 
 Number of Observations = 11 
 Blind Sample ID = M220  Mean = 0.17 
 % Relative Standard Deviation = 8.0 
 Number of Observations = 15 
 Blind Sample ID = M218  Mean = 0.27 
 % Relative Standard Deviation = 0.6 
 Number of Observations = 4 
 Blind Sample ID = M216  Mean = 0.14 
 % Relative Standard Deviation = 4.1 
 Number of Observations = 8 
 Blind Sample ID = M214  Mean = 0.29 
 % Relative Standard Deviation = 60.1 
 Number of Observations = 15 
 Blind Sample ID =
The SGPlot Procedure


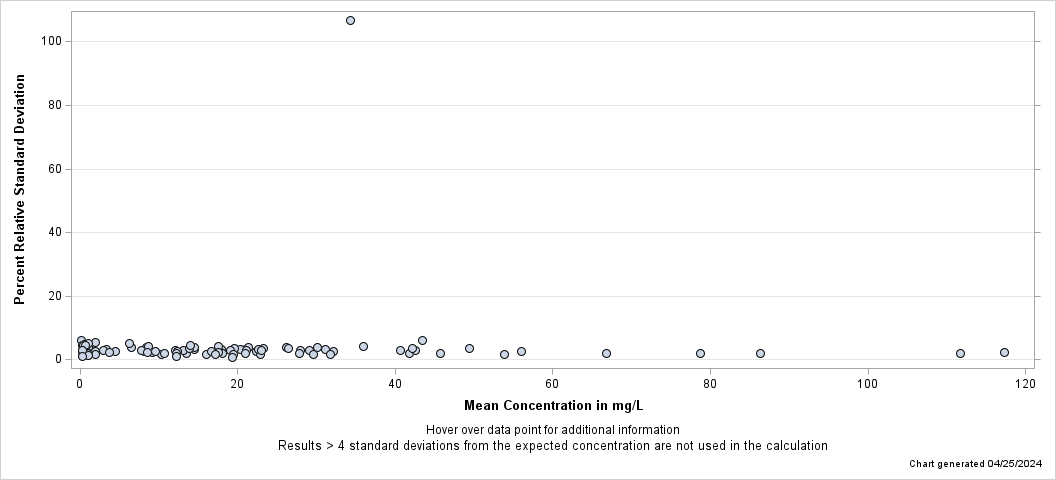
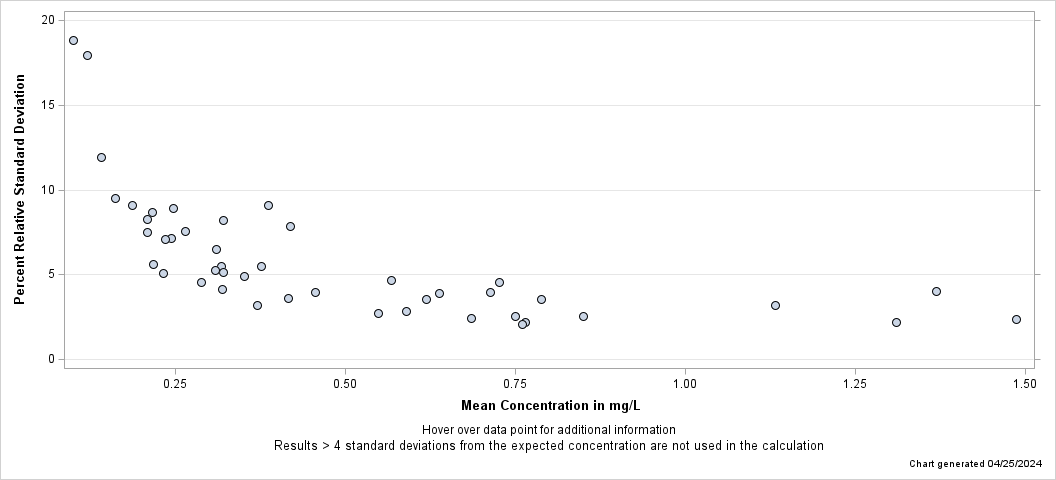
- Calcium, fltd, ICP-OES -
Percent Relative Standard Deviation
Lab: NWQL, PCode: 00915, MCode: PLA11
Dates: 10/29/18 through 11/07/24
Open Data Set

 Mean = 12.25 
 % Relative Standard Deviation = 1.7 
 Number of Observations = 15 
 Blind Sample ID = T251  Mean = 87.03 
 % Relative Standard Deviation = 1.7 
 Number of Observations = 13 
 Blind Sample ID = T249  Mean = 78.81 
 % Relative Standard Deviation = 2.1 
 Number of Observations = 31 
 Blind Sample ID = T247  Mean = 19.35 
 % Relative Standard Deviation = 1.1 
 Number of Observations = 28 
 Blind Sample ID = T245  Mean = 66.75 
 % Relative Standard Deviation = 2.0 
 Number of Observations = 42 
 Blind Sample ID = T243  Mean = 19.39 
 % Relative Standard Deviation = 1.5 
 Number of Observations = 48 
 Blind Sample ID = T241  Mean = 111.80 
 % Relative Standard Deviation = 2.0 
 Number of Observations = 48 
 Blind Sample ID = T239  Mean = 31.77 
 % Relative Standard Deviation = 1.6 
 Number of Observations = 42 
 Blind Sample ID = T237  Mean = 17.16 
 % Relative Standard Deviation = 1.7 
 Number of Observations = 46 
 Blind Sample ID = T235  Mean = 17.55 
 % Relative Standard Deviation = 2.2 
 Number of Observations = 39 
 Blind Sample ID = T233  Mean = 29.59 
 % Relative Standard Deviation = 1.7 
 Number of Observations = 41 
 Blind Sample ID = T231  Mean = 45.68 
 % Relative Standard Deviation = 2.0 
 Number of Observations = 43 
 Blind Sample ID = T229  Mean = 10.66 
 % Relative Standard Deviation = 2.2 
 Number of Observations = 28 
 Blind Sample ID = T227  Mean = 117.69 
 % Relative Standard Deviation = 1.9 
 Number of Observations = 26 
 Blind Sample ID = T225  Mean = 3.64 
 % Relative Standard Deviation = 2.0 
 Number of Observations = 15 
 Blind Sample ID = T223  Mean = 17.65 
 % Relative Standard Deviation = 2.3 
 Number of Observations = 13 
 Blind Sample ID = T221  Mean = 0.23 
 % Relative Standard Deviation = 1.7 
 Number of Observations = 7 
 Blind Sample ID = P75  Mean = 1.01 
 % Relative Standard Deviation = 1.3 
 Number of Observations = 16 
 Blind Sample ID = P74  Mean = 0.26 
 % Relative Standard Deviation = 2.6 
 Number of Observations = 24 
 Blind Sample ID = P73  Mean = 0.35 
 % Relative Standard Deviation = 1.9 
 Number of Observations = 16 
 Blind Sample ID = P72  Mean = 0.40 
 % Relative Standard Deviation = 2.2 
 Number of Observations = 16 
 Blind Sample ID = P71  Mean = 0.84 
 % Relative Standard Deviation = 2.0 
 Number of Observations = 8 
 Blind Sample ID = P70  Mean = 0.22 
 % Relative Standard Deviation = 2.6 
 Number of Observations = 16 
 Blind Sample ID = P69  Mean = 0.92 
 % Relative Standard Deviation = 1.4 
 Number of Observations = 8 
 Blind Sample ID = P68  Mean = 0.29 
 % Relative Standard Deviation = 2.4 
 Number of Observations = 16 
 Blind Sample ID = P67  Mean = 0.97 
 % Relative Standard Deviation = 2.0 
 Number of Observations = 7 
 Blind Sample ID = P66  Mean = 0.31 
 % Relative Standard Deviation = 0.5 
 Number of Observations = 5 
 Blind Sample ID = P65
The SGPlot Procedure


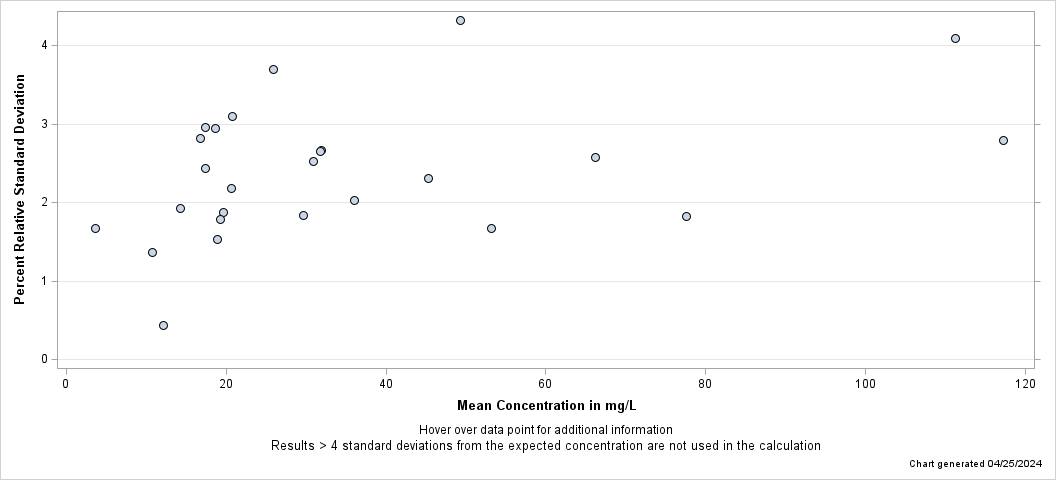
- Calcium, unfltd, ICP-OES, recov -
Percent Relative Standard Deviation
Lab: NWQL, PCode: 00916, MCode: PLO07
Dates: 10/24/18 through 10/04/24
Open Data Set

 Mean = 12.22 
 % Relative Standard Deviation = 2.4 
 Number of Observations = 7 
 Blind Sample ID = T251  Mean = 87.84 
 % Relative Standard Deviation = 2.5 
 Number of Observations = 5 
 Blind Sample ID = T249  Mean = 77.45 
 % Relative Standard Deviation = 2.3 
 Number of Observations = 16 
 Blind Sample ID = T247  Mean = 19.10 
 % Relative Standard Deviation = 2.9 
 Number of Observations = 12 
 Blind Sample ID = T245  Mean = 66.41 
 % Relative Standard Deviation = 2.4 
 Number of Observations = 18 
 Blind Sample ID = T243  Mean = 19.34 
 % Relative Standard Deviation = 1.8 
 Number of Observations = 24 
 Blind Sample ID = T241  Mean = 111.24 
 % Relative Standard Deviation = 4.1 
 Number of Observations = 24 
 Blind Sample ID = T239  Mean = 31.77 
 % Relative Standard Deviation = 2.7 
 Number of Observations = 18 
 Blind Sample ID = T237  Mean = 16.72 
 % Relative Standard Deviation = 2.8 
 Number of Observations = 22 
 Blind Sample ID = T235  Mean = 17.44 
 % Relative Standard Deviation = 3.0 
 Number of Observations = 18 
 Blind Sample ID = T233  Mean = 29.69 
 % Relative Standard Deviation = 1.8 
 Number of Observations = 18 
 Blind Sample ID = T231  Mean = 45.28 
 % Relative Standard Deviation = 2.3 
 Number of Observations = 21 
 Blind Sample ID = T229  Mean = 10.73 
 % Relative Standard Deviation = 1.4 
 Number of Observations = 16 
 Blind Sample ID = T227  Mean = 117.35 
 % Relative Standard Deviation = 2.4 
 Number of Observations = 12 
 Blind Sample ID = T225  Mean = 3.68 
 % Relative Standard Deviation = 1.0 
 Number of Observations = 7 
 Blind Sample ID = T223  Mean = 17.41 
 % Relative Standard Deviation = 1.1 
 Number of Observations = 5 
 Blind Sample ID = T221
The SGPlot Procedure


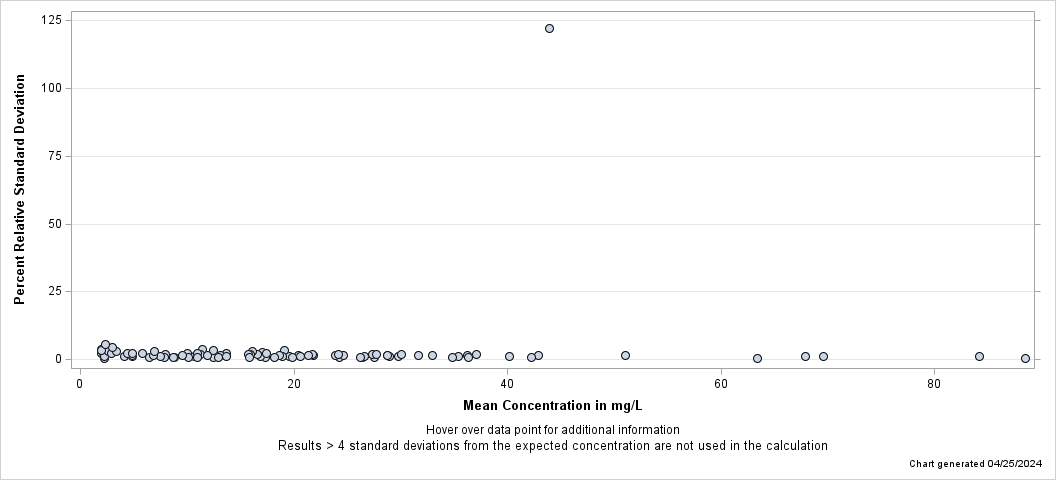
- Chloride, fltd, IC -
Percent Relative Standard Deviation
Lab: NWQL, PCode: 00940, MCode: IC022
Dates: 10/19/18 through 10/31/24
Open Data Set

 Mean = 2.27 
 % Relative Standard Deviation = 7.7 
 Number of Observations = 7 
 Blind Sample ID = P75  Mean = 1.99 
 % Relative Standard Deviation = 4.1 
 Number of Observations = 16 
 Blind Sample ID = P74  Mean = 2.99 
 % Relative Standard Deviation = 4.5 
 Number of Observations = 24 
 Blind Sample ID = P73  Mean = 3.34 
 % Relative Standard Deviation = 3.0 
 Number of Observations = 16 
 Blind Sample ID = P72  Mean = 2.95 
 % Relative Standard Deviation = 2.4 
 Number of Observations = 16 
 Blind Sample ID = P71  Mean = 6.90 
 % Relative Standard Deviation = 2.9 
 Number of Observations = 8 
 Blind Sample ID = P70  Mean = 2.59 
 % Relative Standard Deviation = 3.0 
 Number of Observations = 16 
 Blind Sample ID = P69  Mean = 2.23 
 % Relative Standard Deviation = 1.3 
 Number of Observations = 8 
 Blind Sample ID = P68  Mean = 2.59 
 % Relative Standard Deviation = 3.8 
 Number of Observations = 16 
 Blind Sample ID = P67  Mean = 8.70 
 % Relative Standard Deviation = 0.9 
 Number of Observations = 7 
 Blind Sample ID = P66  Mean = 2.02 
 % Relative Standard Deviation = 2.3 
 Number of Observations = 5 
 Blind Sample ID = P65  Mean = 186.13 
 % Relative Standard Deviation = 1.1 
 Number of Observations = 7 
 Blind Sample ID = M244  Mean = 41.69 
 % Relative Standard Deviation = 1.8 
 Number of Observations = 9 
 Blind Sample ID = M242  Mean = 28.97 
 % Relative Standard Deviation = 1.3 
 Number of Observations = 12 
 Blind Sample ID = M240  Mean = 88.60 
 % Relative Standard Deviation = 0.9 
 Number of Observations = 15 
 Blind Sample ID = M238  Mean = 84.42 
 % Relative Standard Deviation = 1.7 
 Number of Observations = 18 
 Blind Sample ID = M236  Mean = 35.01 
 % Relative Standard Deviation = 1.0 
 Number of Observations = 23 
 Blind Sample ID = M234  Mean = 69.55 
 % Relative Standard Deviation = 1.2 
 Number of Observations = 17 
 Blind Sample ID = M232  Mean = 36.30 
 % Relative Standard Deviation = 0.9 
 Number of Observations = 24 
 Blind Sample ID = M230  Mean = 9.51 
 % Relative Standard Deviation = 1.6 
 Number of Observations = 18 
 Blind Sample ID = M228  Mean = 26.25 
 % Relative Standard Deviation = 1.0 
 Number of Observations = 24 
 Blind Sample ID = M226  Mean = 10.13 
 % Relative Standard Deviation = 1.0 
 Number of Observations = 18 
 Blind Sample ID = M224  Mean = 7.50 
 % Relative Standard Deviation = 1.1 
 Number of Observations = 23 
 Blind Sample ID = M222  Mean = 15.97 
 % Relative Standard Deviation = 0.6 
 Number of Observations = 11 
 Blind Sample ID = M220  Mean = 67.90 
 % Relative Standard Deviation = 1.4 
 Number of Observations = 14 
 Blind Sample ID = M218  Mean = 20.00 
 % Relative Standard Deviation = 0.8 
 Number of Observations = 4 
 Blind Sample ID = M216  Mean = 29.19 
 % Relative Standard Deviation = 1.2 
 Number of Observations = 8 
 Blind Sample ID = M214
The SGPlot Procedure


- Dissolved Inorganic Carbon (DIC), fltd, NDIR -
Percent Relative Standard Deviation
Lab: NWQL, PCode: 00691, MCode: IR006
Dates: 03/12/19 through 09/17/19
Open Data Set

 Mean = 11.99 
 % Relative Standard Deviation = 52.2 
 Number of Observations = 14 
 Blind Sample ID =
The SGPlot Procedure


- Dissolved solids, water, fltd, dried at 180 deg C -
Percent Relative Standard Deviation
Lab: NWQL, PCode: 70300, MCode: ROE10
Dates: 10/23/18 through 10/17/24
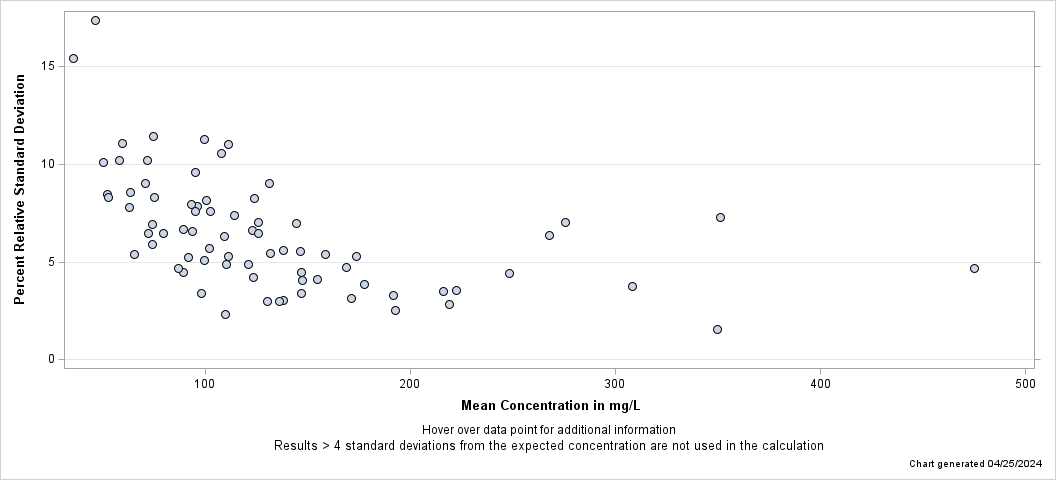
Open Data Set

 Mean = 517.20 
 % Relative Standard Deviation = 6.9 
 Number of Observations = 7 
 Blind Sample ID = M244  Mean = 138.63 
 % Relative Standard Deviation = 4.1 
 Number of Observations = 9 
 Blind Sample ID = M242  Mean = 132.04 
 % Relative Standard Deviation = 5.4 
 Number of Observations = 12 
 Blind Sample ID = M240  Mean = 273.22 
 % Relative Standard Deviation = 7.3 
 Number of Observations = 15 
 Blind Sample ID = M238  Mean = 351.97 
 % Relative Standard Deviation = 7.8 
 Number of Observations = 18 
 Blind Sample ID = M236  Mean = 122.53 
 % Relative Standard Deviation = 4.1 
 Number of Observations = 24 
 Blind Sample ID = M234  Mean = 267.56 
 % Relative Standard Deviation = 6.4 
 Number of Observations = 18 
 Blind Sample ID = M232  Mean = 146.60 
 % Relative Standard Deviation = 3.4 
 Number of Observations = 23 
 Blind Sample ID = M230  Mean = 98.17 
 % Relative Standard Deviation = 3.4 
 Number of Observations = 17 
 Blind Sample ID = M228  Mean = 123.73 
 % Relative Standard Deviation = 8.2 
 Number of Observations = 24 
 Blind Sample ID = M226  Mean = 63.51 
 % Relative Standard Deviation = 8.6 
 Number of Observations = 18 
 Blind Sample ID = M224  Mean = 89.87 
 % Relative Standard Deviation = 8.2 
 Number of Observations = 23 
 Blind Sample ID = M222  Mean = 126.02 
 % Relative Standard Deviation = 6.8 
 Number of Observations = 11 
 Blind Sample ID = M220  Mean = 478.91 
 % Relative Standard Deviation = 5.6 
 Number of Observations = 14 
 Blind Sample ID = M218  Mean = 97.52 
 % Relative Standard Deviation = 7.7 
 Number of Observations = 4 
 Blind Sample ID = M216  Mean = 217.76 
 % Relative Standard Deviation = 4.4 
 Number of Observations = 8 
 Blind Sample ID = M214
The SGPlot Procedure


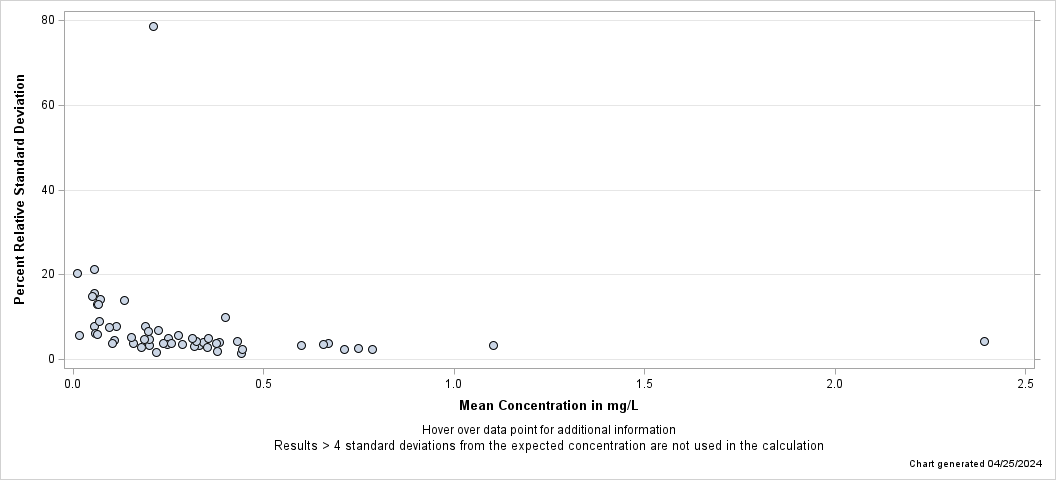
- Fluoride, fltd, IC -
Percent Relative Standard Deviation
Lab: NWQL, PCode: 00950, MCode: IC003
Dates: 10/19/18 through 10/31/24
Open Data Set

 Mean = 0.07 
 % Relative Standard Deviation = 17.2 
 Number of Observations = 7 
 Blind Sample ID = P75  Mean = 0.09 
 % Relative Standard Deviation = 6.8 
 Number of Observations = 15 
 Blind Sample ID = P74  Mean = 0.06 
 % Relative Standard Deviation = 11.7 
 Number of Observations = 24 
 Blind Sample ID = P73  Mean = 0.11 
 % Relative Standard Deviation = 7.8 
 Number of Observations = 16 
 Blind Sample ID = P72  Mean = 0.05 
 % Relative Standard Deviation = 16.0 
 Number of Observations = 16 
 Blind Sample ID = P71  Mean = 0.40 
 % Relative Standard Deviation = 9.9 
 Number of Observations = 5 
 Blind Sample ID = P70  Mean = 0.06 
 % Relative Standard Deviation = 13.0 
 Number of Observations = 16 
 Blind Sample ID = P69  Mean = 0.02 
 % Relative Standard Deviation = 5.8 
 Number of Observations = 8 
 Blind Sample ID = P68  Mean = 0.06 
 % Relative Standard Deviation = 6.1 
 Number of Observations = 15 
 Blind Sample ID = P67  Mean = 0.20 
 % Relative Standard Deviation = 6.6 
 Number of Observations = 7 
 Blind Sample ID = P66  Mean = 0.05 
 % Relative Standard Deviation = 12.3 
 Number of Observations = 5 
 Blind Sample ID = P65  Mean = 0.39 
 % Relative Standard Deviation = 4.3 
 Number of Observations = 7 
 Blind Sample ID = M244  Mean = 0.33 
 % Relative Standard Deviation = 5.2 
 Number of Observations = 9 
 Blind Sample ID = M242  Mean = 0.32 
 % Relative Standard Deviation = 3.8 
 Number of Observations = 12 
 Blind Sample ID = M240  Mean = 0.29 
 % Relative Standard Deviation = 7.6 
 Number of Observations = 15 
 Blind Sample ID = M238  Mean = 2.39 
 % Relative Standard Deviation = 4.1 
 Number of Observations = 18 
 Blind Sample ID = M236  Mean = 1.12 
 % Relative Standard Deviation = 4.2 
 Number of Observations = 23 
 Blind Sample ID = M234  Mean = 0.22 
 % Relative Standard Deviation = 6.9 
 Number of Observations = 18 
 Blind Sample ID = M232  Mean = 0.32 
 % Relative Standard Deviation = 4.4 
 Number of Observations = 24 
 Blind Sample ID = M230  Mean = 0.71 
 % Relative Standard Deviation = 2.4 
 Number of Observations = 18 
 Blind Sample ID = M228  Mean = 0.26 
 % Relative Standard Deviation = 3.9 
 Number of Observations = 24 
 Blind Sample ID = M226  Mean = 0.75 
 % Relative Standard Deviation = 2.7 
 Number of Observations = 18 
 Blind Sample ID = M224  Mean = 0.38 
 % Relative Standard Deviation = 3.9 
 Number of Observations = 23 
 Blind Sample ID = M222  Mean = 0.66 
 % Relative Standard Deviation = 3.9 
 Number of Observations = 11 
 Blind Sample ID = M220  Mean = 0.36 
 % Relative Standard Deviation = 5.7 
 Number of Observations = 14 
 Blind Sample ID = M218  Mean = 0.25 
 % Relative Standard Deviation = 4.6 
 Number of Observations = 4 
 Blind Sample ID = M216  Mean = 0.61 
 % Relative Standard Deviation = 5.4 
 Number of Observations = 8 
 Blind Sample ID = M214
The SGPlot Procedure


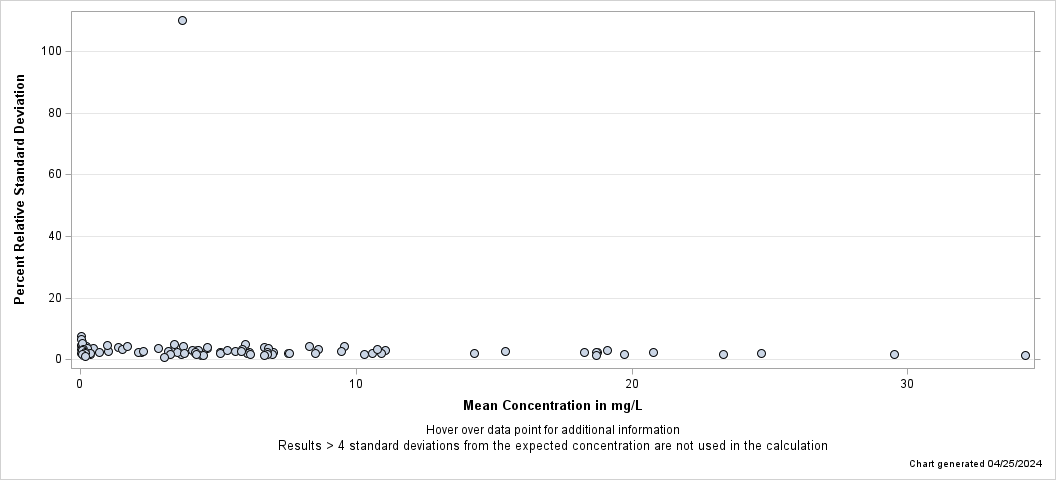
- Magnesium, fltd, ICP-OES -
Percent Relative Standard Deviation
Lab: NWQL, PCode: 00925, MCode: PLA11
Dates: 10/29/18 through 11/07/24
Open Data Set

 Mean = 3.07 
 % Relative Standard Deviation = 1.8 
 Number of Observations = 15 
 Blind Sample ID = T251  Mean = 20.96 
 % Relative Standard Deviation = 2.0 
 Number of Observations = 13 
 Blind Sample ID = T249  Mean = 18.72 
 % Relative Standard Deviation = 1.6 
 Number of Observations = 31 
 Blind Sample ID = T247  Mean = 6.71 
 % Relative Standard Deviation = 1.9 
 Number of Observations = 28 
 Blind Sample ID = T245  Mean = 34.30 
 % Relative Standard Deviation = 1.3 
 Number of Observations = 42 
 Blind Sample ID = T243  Mean = 6.78 
 % Relative Standard Deviation = 1.6 
 Number of Observations = 48 
 Blind Sample ID = T241  Mean = 29.51 
 % Relative Standard Deviation = 1.7 
 Number of Observations = 48 
 Blind Sample ID = T239  Mean = 7.58 
 % Relative Standard Deviation = 1.9 
 Number of Observations = 42 
 Blind Sample ID = T237  Mean = 4.22 
 % Relative Standard Deviation = 1.6 
 Number of Observations = 45 
 Blind Sample ID = T235  Mean = 6.77 
 % Relative Standard Deviation = 2.5 
 Number of Observations = 39 
 Blind Sample ID = T233  Mean = 14.30 
 % Relative Standard Deviation = 1.9 
 Number of Observations = 41 
 Blind Sample ID = T231  Mean = 23.32 
 % Relative Standard Deviation = 1.7 
 Number of Observations = 43 
 Blind Sample ID = T229  Mean = 3.26 
 % Relative Standard Deviation = 1.8 
 Number of Observations = 28 
 Blind Sample ID = T227  Mean = 15.42 
 % Relative Standard Deviation = 2.1 
 Number of Observations = 26 
 Blind Sample ID = T225  Mean = 4.10 
 % Relative Standard Deviation = 2.3 
 Number of Observations = 15 
 Blind Sample ID = T223  Mean = 3.76 
 % Relative Standard Deviation = 1.8 
 Number of Observations = 13 
 Blind Sample ID = T221  Mean = 0.19 
 % Relative Standard Deviation = 2.2 
 Number of Observations = 7 
 Blind Sample ID = P75  Mean = 0.09 
 % Relative Standard Deviation = 1.7 
 Number of Observations = 16 
 Blind Sample ID = P74  Mean = 0.17 
 % Relative Standard Deviation = 1.8 
 Number of Observations = 24 
 Blind Sample ID = P73  Mean = 0.10 
 % Relative Standard Deviation = 1.5 
 Number of Observations = 16 
 Blind Sample ID = P72  Mean = 0.20 
 % Relative Standard Deviation = 2.3 
 Number of Observations = 16 
 Blind Sample ID = P71  Mean = 0.36 
 % Relative Standard Deviation = 1.9 
 Number of Observations = 8 
 Blind Sample ID = P70  Mean = 0.07 
 % Relative Standard Deviation = 3.1 
 Number of Observations = 16 
 Blind Sample ID = P69  Mean = 0.11 
 % Relative Standard Deviation = 2.4 
 Number of Observations = 8 
 Blind Sample ID = P68  Mean = 0.08 
 % Relative Standard Deviation = 2.5 
 Number of Observations = 16 
 Blind Sample ID = P67  Mean = 0.70 
 % Relative Standard Deviation = 2.4 
 Number of Observations = 7 
 Blind Sample ID = P66  Mean = 0.09 
 % Relative Standard Deviation = 1.2 
 Number of Observations = 5 
 Blind Sample ID = P65
The SGPlot Procedure


- Magnesium, unfltd, ICP-OES, recov -
Percent Relative Standard Deviation
Lab: NWQL, PCode: 00927, MCode: PLO07
Dates: 10/24/18 through 10/04/24
Open Data Set

 Mean = 3.07 
 % Relative Standard Deviation = 1.0 
 Number of Observations = 7 
 Blind Sample ID = T251  Mean = 21.22 
 % Relative Standard Deviation = 3.3 
 Number of Observations = 5 
 Blind Sample ID = T249  Mean = 18.53 
 % Relative Standard Deviation = 2.0 
 Number of Observations = 16 
 Blind Sample ID = T247  Mean = 6.67 
 % Relative Standard Deviation = 3.0 
 Number of Observations = 12 
 Blind Sample ID = T245  Mean = 34.46 
 % Relative Standard Deviation = 2.2 
 Number of Observations = 18 
 Blind Sample ID = T243  Mean = 6.79 
 % Relative Standard Deviation = 2.2 
 Number of Observations = 24 
 Blind Sample ID = T241  Mean = 29.21 
 % Relative Standard Deviation = 3.2 
 Number of Observations = 24 
 Blind Sample ID = T239  Mean = 7.54 
 % Relative Standard Deviation = 2.8 
 Number of Observations = 18 
 Blind Sample ID = T237  Mean = 4.16 
 % Relative Standard Deviation = 2.3 
 Number of Observations = 22 
 Blind Sample ID = T235  Mean = 6.69 
 % Relative Standard Deviation = 3.5 
 Number of Observations = 18 
 Blind Sample ID = T233  Mean = 14.24 
 % Relative Standard Deviation = 1.7 
 Number of Observations = 18 
 Blind Sample ID = T231  Mean = 23.12 
 % Relative Standard Deviation = 2.0 
 Number of Observations = 21 
 Blind Sample ID = T229  Mean = 3.28 
 % Relative Standard Deviation = 1.3 
 Number of Observations = 16 
 Blind Sample ID = T227  Mean = 15.35 
 % Relative Standard Deviation = 1.6 
 Number of Observations = 12 
 Blind Sample ID = T225  Mean = 4.11 
 % Relative Standard Deviation = 2.2 
 Number of Observations = 7 
 Blind Sample ID = T223  Mean = 3.76 
 % Relative Standard Deviation = 1.0 
 Number of Observations = 5 
 Blind Sample ID = T221
The SGPlot Procedure


- Potassium, fltd, ICP-OES -
Percent Relative Standard Deviation
Lab: NWQL, PCode: 00935, MCode: PLO03
Dates: 10/29/18 through 11/07/24
Open Data Set

 Mean = 1.71 
 % Relative Standard Deviation = 2.9 
 Number of Observations = 17 
 Blind Sample ID = T251  Mean = 5.29 
 % Relative Standard Deviation = 2.2 
 Number of Observations = 17 
 Blind Sample ID = T249  Mean = 6.16 
 % Relative Standard Deviation = 1.6 
 Number of Observations = 39 
 Blind Sample ID = T247  Mean = 1.20 
 % Relative Standard Deviation = 4.7 
 Number of Observations = 32 
 Blind Sample ID = T245  Mean = 9.47 
 % Relative Standard Deviation = 1.8 
 Number of Observations = 48 
 Blind Sample ID = T243  Mean = 1.16 
 % Relative Standard Deviation = 6.0 
 Number of Observations = 58 
 Blind Sample ID = T241  Mean = 8.80 
 % Relative Standard Deviation = 2.6 
 Number of Observations = 54 
 Blind Sample ID = T239  Mean = 2.34 
 % Relative Standard Deviation = 3.1 
 Number of Observations = 54 
 Blind Sample ID = T237  Mean = 1.46 
 % Relative Standard Deviation = 4.0 
 Number of Observations = 57 
 Blind Sample ID = T235  Mean = 1.57 
 % Relative Standard Deviation = 5.3 
 Number of Observations = 45 
 Blind Sample ID = T233  Mean = 1.38 
 % Relative Standard Deviation = 5.2 
 Number of Observations = 45 
 Blind Sample ID = T231  Mean = 4.47 
 % Relative Standard Deviation = 2.3 
 Number of Observations = 52 
 Blind Sample ID = T229  Mean = 0.47 
 % Relative Standard Deviation = 11.4 
 Number of Observations = 31 
 Blind Sample ID = T227  Mean = 2.54 
 % Relative Standard Deviation = 2.7 
 Number of Observations = 30 
 Blind Sample ID = T225  Mean = 1.01 
 % Relative Standard Deviation = 7.8 
 Number of Observations = 15 
 Blind Sample ID = T223  Mean = 1.84 
 % Relative Standard Deviation = 4.3 
 Number of Observations = 13 
 Blind Sample ID = T221  Mean = 2.68 
 % Relative Standard Deviation = 65.0 
 Number of Observations = 37 
 Blind Sample ID =
The SGPlot Procedure


- Potassium, fltd, ICP-OES, LL -
Percent Relative Standard Deviation
Lab: NWQL, PCode: 00935, MCode: PLO02
Dates: 08/26/19 through 09/27/24
Open Data Set

 Mean = 0.06 
 % Relative Standard Deviation = 1.8 
 Number of Observations = 7 
 Blind Sample ID = P75  Mean = 0.73 
 % Relative Standard Deviation = 1.3 
 Number of Observations = 16 
 Blind Sample ID = P74  Mean = 0.18 
 % Relative Standard Deviation = 2.5 
 Number of Observations = 24 
 Blind Sample ID = P73  Mean = 0.20 
 % Relative Standard Deviation = 1.5 
 Number of Observations = 16 
 Blind Sample ID = P72  Mean = 0.14 
 % Relative Standard Deviation = 1.8 
 Number of Observations = 16 
 Blind Sample ID = P71  Mean = 0.42 
 % Relative Standard Deviation = 2.2 
 Number of Observations = 8 
 Blind Sample ID = P70  Mean = 0.01 
 % Relative Standard Deviation = 8.8 
 Number of Observations = 16 
 Blind Sample ID = P69  Mean = 0.16 
 % Relative Standard Deviation = 1.9 
 Number of Observations = 8 
 Blind Sample ID = P68  Mean = 0.11 
 % Relative Standard Deviation = 2.3 
 Number of Observations = 10 
 Blind Sample ID = P67
The SGPlot Procedure


- Silica, fltd, DA -
Percent Relative Standard Deviation
Lab: NWQL, PCode: 00955, MCode: CL151
Dates: 11/06/18 through 10/10/24
Open Data Set

 Mean = 14.66 
 % Relative Standard Deviation = 1.4 
 Number of Observations = 5 
 Blind Sample ID = M244  Mean = 13.53 
 % Relative Standard Deviation = 2.8 
 Number of Observations = 5 
 Blind Sample ID = M242  Mean = 13.28 
 % Relative Standard Deviation = 1.8 
 Number of Observations = 7 
 Blind Sample ID = M240  Mean = 13.33 
 % Relative Standard Deviation = 3.5 
 Number of Observations = 7 
 Blind Sample ID = M238  Mean = 6.62 
 % Relative Standard Deviation = 3.1 
 Number of Observations = 12 
 Blind Sample ID = M236  Mean = 11.41 
 % Relative Standard Deviation = 2.5 
 Number of Observations = 12 
 Blind Sample ID = M234  Mean = 7.94 
 % Relative Standard Deviation = 2.3 
 Number of Observations = 12 
 Blind Sample ID = M232  Mean = 10.36 
 % Relative Standard Deviation = 3.3 
 Number of Observations = 12 
 Blind Sample ID = M230  Mean = 10.60 
 % Relative Standard Deviation = 3.2 
 Number of Observations = 12 
 Blind Sample ID = M226  Mean = 11.31 
 % Relative Standard Deviation = 2.0 
 Number of Observations = 12 
 Blind Sample ID = M224  Mean = 6.16 
 % Relative Standard Deviation = 2.6 
 Number of Observations = 11 
 Blind Sample ID = M222  Mean = 6.63 
 % Relative Standard Deviation = 1.3 
 Number of Observations = 7 
 Blind Sample ID = M220  Mean = 24.19 
 % Relative Standard Deviation = 2.1 
 Number of Observations = 7 
 Blind Sample ID = M218  Mean = 9.44 
 % Relative Standard Deviation = 3.8 
 Number of Observations = 4 
 Blind Sample ID = M214
The SGPlot Procedure


- Silica, fltd, ICP-OES -
Percent Relative Standard Deviation
Lab: NWQL, PCode: 00955, MCode: PLA11
Dates: 10/29/18 through 11/07/24
Open Data Set

 Mean = 8.13 
 % Relative Standard Deviation = 1.4 
 Number of Observations = 17 
 Blind Sample ID = T251  Mean = 14.74 
 % Relative Standard Deviation = 2.0 
 Number of Observations = 17 
 Blind Sample ID = T249  Mean = 23.58 
 % Relative Standard Deviation = 2.9 
 Number of Observations = 38 
 Blind Sample ID = T247  Mean = 5.73 
 % Relative Standard Deviation = 1.3 
 Number of Observations = 32 
 Blind Sample ID = T245  Mean = 7.16 
 % Relative Standard Deviation = 1.9 
 Number of Observations = 46 
 Blind Sample ID = T243  Mean = 6.64 
 % Relative Standard Deviation = 1.8 
 Number of Observations = 59 
 Blind Sample ID = T241  Mean = 7.46 
 % Relative Standard Deviation = 2.9 
 Number of Observations = 54 
 Blind Sample ID = T239  Mean = 8.46 
 % Relative Standard Deviation = 3.3 
 Number of Observations = 54 
 Blind Sample ID = T237  Mean = 14.34 
 % Relative Standard Deviation = 2.4 
 Number of Observations = 57 
 Blind Sample ID = T235  Mean = 11.96 
 % Relative Standard Deviation = 2.5 
 Number of Observations = 45 
 Blind Sample ID = T233  Mean = 5.44 
 % Relative Standard Deviation = 1.9 
 Number of Observations = 47 
 Blind Sample ID = T231  Mean = 14.93 
 % Relative Standard Deviation = 3.3 
 Number of Observations = 54 
 Blind Sample ID = T229  Mean = 4.83 
 % Relative Standard Deviation = 1.9 
 Number of Observations = 32 
 Blind Sample ID = T227  Mean = 15.47 
 % Relative Standard Deviation = 5.8 
 Number of Observations = 32 
 Blind Sample ID = T225  Mean = 7.81 
 % Relative Standard Deviation = 2.0 
 Number of Observations = 18 
 Blind Sample ID = T223  Mean = 12.83 
 % Relative Standard Deviation = 1.8 
 Number of Observations = 15 
 Blind Sample ID = T221  Mean = 10.51 
 % Relative Standard Deviation = 38.3 
 Number of Observations = 35 
 Blind Sample ID =
The SGPlot Procedure


- Silica, unfltd, ICP-OES, recov -
Percent Relative Standard Deviation
Lab: NWQL, PCode: 00956, MCode: PLO07
Dates: 11/13/18 through 09/06/24
Open Data Set

 Mean = 22.62 
 % Relative Standard Deviation = 1.5 
 Number of Observations = 4 
 Blind Sample ID = T247  Mean = 5.65 
 % Relative Standard Deviation = 1.9 
 Number of Observations = 6 
 Blind Sample ID = T245  Mean = 7.19 
 % Relative Standard Deviation = 1.8 
 Number of Observations = 9 
 Blind Sample ID = T243  Mean = 6.63 
 % Relative Standard Deviation = 2.1 
 Number of Observations = 10 
 Blind Sample ID = T241  Mean = 7.31 
 % Relative Standard Deviation = 2.4 
 Number of Observations = 12 
 Blind Sample ID = T239  Mean = 8.38 
 % Relative Standard Deviation = 1.2 
 Number of Observations = 12 
 Blind Sample ID = T237  Mean = 13.85 
 % Relative Standard Deviation = 3.5 
 Number of Observations = 12 
 Blind Sample ID = T235  Mean = 11.76 
 % Relative Standard Deviation = 1.8 
 Number of Observations = 12 
 Blind Sample ID = T233  Mean = 5.42 
 % Relative Standard Deviation = 1.9 
 Number of Observations = 12 
 Blind Sample ID = T231  Mean = 14.50 
 % Relative Standard Deviation = 2.4 
 Number of Observations = 10 
 Blind Sample ID = T229  Mean = 4.82 
 % Relative Standard Deviation = 2.4 
 Number of Observations = 8 
 Blind Sample ID = T227  Mean = 15.13 
 % Relative Standard Deviation = 5.5 
 Number of Observations = 8 
 Blind Sample ID = T225  Mean = 7.73 
 % Relative Standard Deviation = 1.2 
 Number of Observations = 3 
 Blind Sample ID = T223  Mean = 12.89 
 % Relative Standard Deviation = 3.6 
 Number of Observations = 3 
 Blind Sample ID = T221
The SGPlot Procedure


- Sodium, fltd, ICP-OES -
Percent Relative Standard Deviation
Lab: NWQL, PCode: 00930, MCode: PLA11
Dates: 10/29/18 through 11/07/24
Open Data Set

 Mean = 13.49 
 % Relative Standard Deviation = 1.9 
 Number of Observations = 15 
 Blind Sample ID = T251  Mean = 70.27 
 % Relative Standard Deviation = 2.7 
 Number of Observations = 13 
 Blind Sample ID = T249  Mean = 96.66 
 % Relative Standard Deviation = 1.9 
 Number of Observations = 31 
 Blind Sample ID = T247  Mean = 14.43 
 % Relative Standard Deviation = 1.3 
 Number of Observations = 28 
 Blind Sample ID = T245  Mean = 53.62 
 % Relative Standard Deviation = 1.8 
 Number of Observations = 42 
 Blind Sample ID = T243  Mean = 16.28 
 % Relative Standard Deviation = 1.6 
 Number of Observations = 48 
 Blind Sample ID = T241  Mean = 106.18 
 % Relative Standard Deviation = 1.8 
 Number of Observations = 48 
 Blind Sample ID = T239  Mean = 21.34 
 % Relative Standard Deviation = 1.9 
 Number of Observations = 42 
 Blind Sample ID = T237  Mean = 27.31 
 % Relative Standard Deviation = 1.9 
 Number of Observations = 46 
 Blind Sample ID = T235  Mean = 16.31 
 % Relative Standard Deviation = 2.1 
 Number of Observations = 39 
 Blind Sample ID = T233  Mean = 34.68 
 % Relative Standard Deviation = 1.6 
 Number of Observations = 41 
 Blind Sample ID = T231  Mean = 25.49 
 % Relative Standard Deviation = 2.1 
 Number of Observations = 43 
 Blind Sample ID = T229  Mean = 6.35 
 % Relative Standard Deviation = 2.0 
 Number of Observations = 28 
 Blind Sample ID = T227  Mean = 115.02 
 % Relative Standard Deviation = 1.8 
 Number of Observations = 26 
 Blind Sample ID = T225  Mean = 7.73 
 % Relative Standard Deviation = 2.3 
 Number of Observations = 15 
 Blind Sample ID = T223  Mean = 17.70 
 % Relative Standard Deviation = 2.4 
 Number of Observations = 13 
 Blind Sample ID = T221  Mean = 1.28 
 % Relative Standard Deviation = 2.9 
 Number of Observations = 16 
 Blind Sample ID = P74  Mean = 0.76 
 % Relative Standard Deviation = 3.3 
 Number of Observations = 24 
 Blind Sample ID = P73  Mean = 2.13 
 % Relative Standard Deviation = 1.8 
 Number of Observations = 16 
 Blind Sample ID = P72  Mean = 1.37 
 % Relative Standard Deviation = 3.5 
 Number of Observations = 8 
 Blind Sample ID = P70  Mean = 0.41 
 % Relative Standard Deviation = 2.1 
 Number of Observations = 6 
 Blind Sample ID = P68  Mean = 2.63 
 % Relative Standard Deviation = 3.0 
 Number of Observations = 7 
 Blind Sample ID = P66
The SGPlot Procedure


- Sodium, unfltd, ICP-OES, recov -
Percent Relative Standard Deviation
Lab: NWQL, PCode: 00929, MCode: PLO07
Dates: 11/13/18 through 10/04/24
Open Data Set

 Mean = 13.98 
 % Relative Standard Deviation = 0.9 
 Number of Observations = 4 
 Blind Sample ID = T251  Mean = 70.44 
 % Relative Standard Deviation = 0.4 
 Number of Observations = 3 
 Blind Sample ID = T249  Mean = 97.10 
 % Relative Standard Deviation = 2.7 
 Number of Observations = 8 
 Blind Sample ID = T247  Mean = 14.32 
 % Relative Standard Deviation = 2.6 
 Number of Observations = 8 
 Blind Sample ID = T245  Mean = 53.78 
 % Relative Standard Deviation = 2.4 
 Number of Observations = 11 
 Blind Sample ID = T243  Mean = 16.38 
 % Relative Standard Deviation = 2.3 
 Number of Observations = 12 
 Blind Sample ID = T241  Mean = 105.81 
 % Relative Standard Deviation = 2.1 
 Number of Observations = 12 
 Blind Sample ID = T239  Mean = 21.32 
 % Relative Standard Deviation = 2.5 
 Number of Observations = 12 
 Blind Sample ID = T237  Mean = 26.60 
 % Relative Standard Deviation = 2.6 
 Number of Observations = 12 
 Blind Sample ID = T235  Mean = 16.31 
 % Relative Standard Deviation = 1.3 
 Number of Observations = 12 
 Blind Sample ID = T233  Mean = 34.78 
 % Relative Standard Deviation = 1.6 
 Number of Observations = 12 
 Blind Sample ID = T231  Mean = 25.54 
 % Relative Standard Deviation = 1.8 
 Number of Observations = 10 
 Blind Sample ID = T229  Mean = 6.43 
 % Relative Standard Deviation = 1.1 
 Number of Observations = 8 
 Blind Sample ID = T227  Mean = 113.59 
 % Relative Standard Deviation = 1.0 
 Number of Observations = 8 
 Blind Sample ID = T225  Mean = 7.93 
 % Relative Standard Deviation = 1.4 
 Number of Observations = 3 
 Blind Sample ID = T223  Mean = 17.76 
 % Relative Standard Deviation = 0.5 
 Number of Observations = 3 
 Blind Sample ID = T221
The SGPlot Procedure


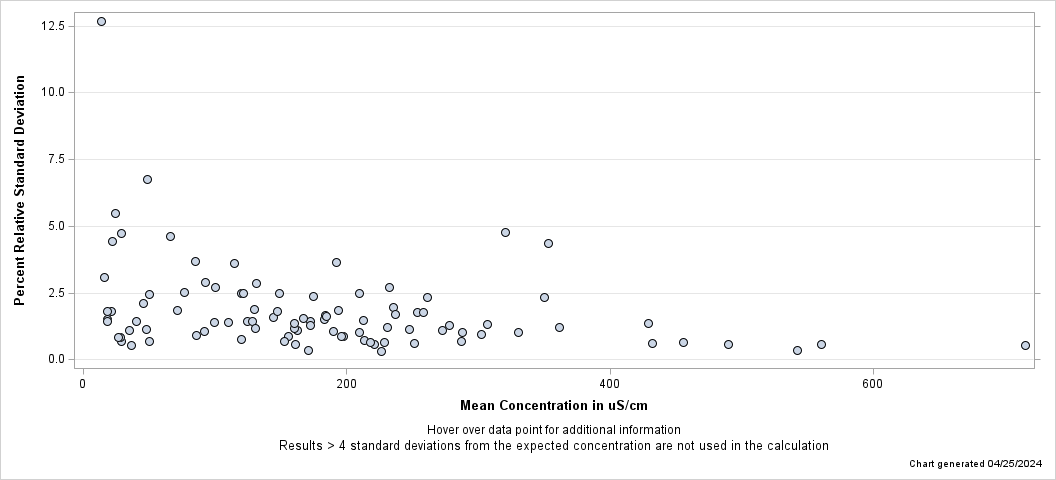
- Specific Cond, LAB, UNF -
Percent Relative Standard Deviation
Lab: NWQL, PCode: 90095, MCode: WHT03
Dates: 10/17/18 through 10/17/24
Open Data Set

 Mean = 17.90 
 % Relative Standard Deviation = 1.7 
 Number of Observations = 7 
 Blind Sample ID = P75  Mean = 18.25 
 % Relative Standard Deviation = 1.6 
 Number of Observations = 16 
 Blind Sample ID = P74  Mean = 21.08 
 % Relative Standard Deviation = 2.8 
 Number of Observations = 24 
 Blind Sample ID = P73  Mean = 34.78 
 % Relative Standard Deviation = 1.0 
 Number of Observations = 16 
 Blind Sample ID = P72  Mean = 21.78 
 % Relative Standard Deviation = 11.9 
 Number of Observations = 16 
 Blind Sample ID = P71  Mean = 49.87 
 % Relative Standard Deviation = 2.4 
 Number of Observations = 8 
 Blind Sample ID = P70  Mean = 48.72 
 % Relative Standard Deviation = 6.8 
 Number of Observations = 15 
 Blind Sample ID = P69  Mean = 27.01 
 % Relative Standard Deviation = 0.8 
 Number of Observations = 8 
 Blind Sample ID = P68  Mean = 24.53 
 % Relative Standard Deviation = 5.5 
 Number of Observations = 16 
 Blind Sample ID = P67  Mean = 47.72 
 % Relative Standard Deviation = 1.1 
 Number of Observations = 7 
 Blind Sample ID = P66  Mean = 17.76 
 % Relative Standard Deviation = 0.8 
 Number of Observations = 5 
 Blind Sample ID = P65  Mean = 878.55 
 % Relative Standard Deviation = 0.9 
 Number of Observations = 7 
 Blind Sample ID = M244  Mean = 249.20 
 % Relative Standard Deviation = 1.2 
 Number of Observations = 9 
 Blind Sample ID = M242  Mean = 227.74 
 % Relative Standard Deviation = 0.6 
 Number of Observations = 12 
 Blind Sample ID = M240  Mean = 455.19 
 % Relative Standard Deviation = 0.8 
 Number of Observations = 15 
 Blind Sample ID = M238  Mean = 542.59 
 % Relative Standard Deviation = 0.4 
 Number of Observations = 18 
 Blind Sample ID = M236  Mean = 218.94 
 % Relative Standard Deviation = 0.8 
 Number of Observations = 24 
 Blind Sample ID = M234  Mean = 432.34 
 % Relative Standard Deviation = 0.6 
 Number of Observations = 18 
 Blind Sample ID = M232  Mean = 261.05 
 % Relative Standard Deviation = 2.3 
 Number of Observations = 24 
 Blind Sample ID = M230  Mean = 170.81 
 % Relative Standard Deviation = 0.4 
 Number of Observations = 18 
 Blind Sample ID = M228  Mean = 221.05 
 % Relative Standard Deviation = 0.6 
 Number of Observations = 24 
 Blind Sample ID = M226  Mean = 99.80 
 % Relative Standard Deviation = 1.4 
 Number of Observations = 18 
 Blind Sample ID = M224  Mean = 160.76 
 % Relative Standard Deviation = 0.6 
 Number of Observations = 23 
 Blind Sample ID = M222  Mean = 213.32 
 % Relative Standard Deviation = 0.5 
 Number of Observations = 11 
 Blind Sample ID = M220  Mean = 714.31 
 % Relative Standard Deviation = 0.4 
 Number of Observations = 15 
 Blind Sample ID = M218  Mean = 152.25 
 % Relative Standard Deviation = 0.7 
 Number of Observations = 4 
 Blind Sample ID = M216  Mean = 363.20 
 % Relative Standard Deviation = 1.8 
 Number of Observations = 8 
 Blind Sample ID = M214  Mean = 102.71 
 % Relative Standard Deviation = 53.0 
 Number of Observations = 4 
 Blind Sample ID =
The SGPlot Procedure


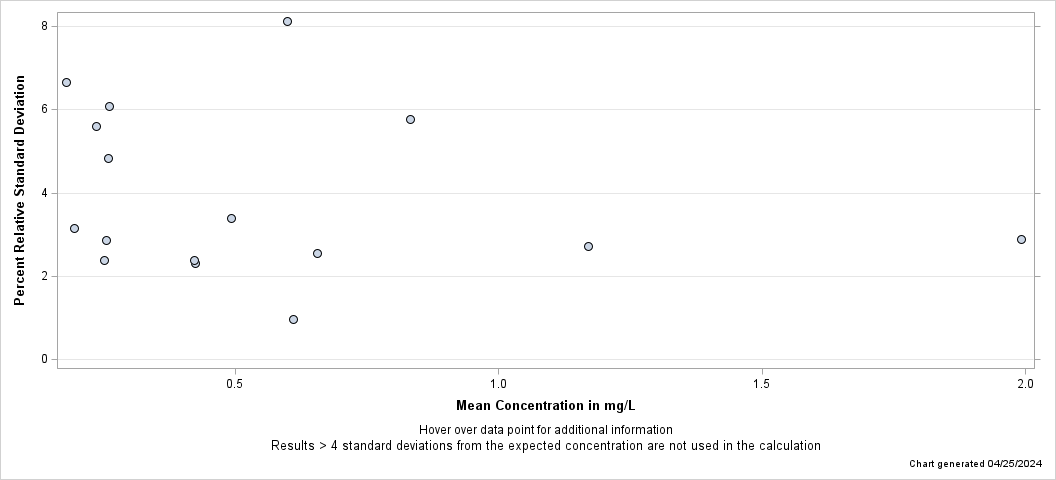
- Sulfate, fltd, IC -
Percent Relative Standard Deviation
Lab: NWQL, PCode: 00945, MCode: IC022
Dates: 10/19/18 through 10/31/24
Open Data Set

 Mean = 0.24 
 % Relative Standard Deviation = 7.2 
 Number of Observations = 7 
 Blind Sample ID = P75  Mean = 0.56 
 % Relative Standard Deviation = 2.0 
 Number of Observations = 16 
 Blind Sample ID = P74  Mean = 0.23 
 % Relative Standard Deviation = 4.4 
 Number of Observations = 24 
 Blind Sample ID = P73  Mean = 0.45 
 % Relative Standard Deviation = 4.6 
 Number of Observations = 16 
 Blind Sample ID = P72  Mean = 0.17 
 % Relative Standard Deviation = 5.6 
 Number of Observations = 16 
 Blind Sample ID = P71  Mean = 0.59 
 % Relative Standard Deviation = 5.2 
 Number of Observations = 8 
 Blind Sample ID = P70  Mean = 0.24 
 % Relative Standard Deviation = 5.3 
 Number of Observations = 16 
 Blind Sample ID = P69  Mean = 0.44 
 % Relative Standard Deviation = 1.4 
 Number of Observations = 8 
 Blind Sample ID = P68  Mean = 0.20 
 % Relative Standard Deviation = 8.4 
 Number of Observations = 16 
 Blind Sample ID = P67  Mean = 0.87 
 % Relative Standard Deviation = 1.5 
 Number of Observations = 7 
 Blind Sample ID = P66  Mean = 0.23 
 % Relative Standard Deviation = 6.9 
 Number of Observations = 5 
 Blind Sample ID = P65  Mean = 76.96 
 % Relative Standard Deviation = 1.9 
 Number of Observations = 7 
 Blind Sample ID = M244  Mean = 8.31 
 % Relative Standard Deviation = 2.7 
 Number of Observations = 9 
 Blind Sample ID = M242  Mean = 28.21 
 % Relative Standard Deviation = 1.5 
 Number of Observations = 12 
 Blind Sample ID = M240  Mean = 14.01 
 % Relative Standard Deviation = 4.9 
 Number of Observations = 15 
 Blind Sample ID = M238  Mean = 98.84 
 % Relative Standard Deviation = 1.9 
 Number of Observations = 18 
 Blind Sample ID = M236  Mean = 8.39 
 % Relative Standard Deviation = 3.0 
 Number of Observations = 23 
 Blind Sample ID = M234  Mean = 73.33 
 % Relative Standard Deviation = 1.5 
 Number of Observations = 18 
 Blind Sample ID = M232  Mean = 10.90 
 % Relative Standard Deviation = 1.8 
 Number of Observations = 24 
 Blind Sample ID = M230  Mean = 26.46 
 % Relative Standard Deviation = 1.9 
 Number of Observations = 18 
 Blind Sample ID = M228  Mean = 13.92 
 % Relative Standard Deviation = 1.1 
 Number of Observations = 24 
 Blind Sample ID = M226  Mean = 5.42 
 % Relative Standard Deviation = 1.4 
 Number of Observations = 18 
 Blind Sample ID = M224  Mean = 9.56 
 % Relative Standard Deviation = 1.1 
 Number of Observations = 23 
 Blind Sample ID = M222  Mean = 21.68 
 % Relative Standard Deviation = 1.0 
 Number of Observations = 11 
 Blind Sample ID = M220  Mean = 211.32 
 % Relative Standard Deviation = 1.4 
 Number of Observations = 14 
 Blind Sample ID = M218  Mean = 8.32 
 % Relative Standard Deviation = 0.8 
 Number of Observations = 4 
 Blind Sample ID = M216  Mean = 79.62 
 % Relative Standard Deviation = 1.1 
 Number of Observations = 8 
 Blind Sample ID = M214
The SGPlot Procedure


- Total Organic Carbon (TOC), UNF, HTCO -
Percent Relative Standard Deviation
Lab: NWQL, PCode: 00680, MCode: COMB9
Dates: 03/07/19 through 09/11/19
Open Data Set

 Mean = 11.33 
 % Relative Standard Deviation = 55.7 
 Number of Observations = 14 
 Blind Sample ID =
The SGPlot Procedure


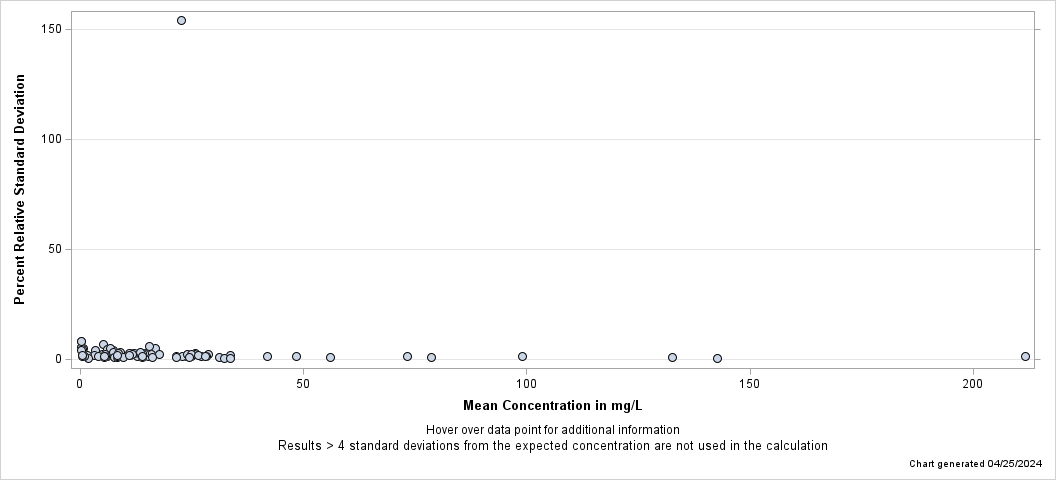
- Total solids, water, unfltd, dried at 105 deg C -
Percent Relative Standard Deviation
Lab: NWQL, PCode: 00500, MCode: ROE12
Dates: 10/16/18 through 10/11/24
Open Data Set

 Mean = 541.55 
 % Relative Standard Deviation = 5.7 
 Number of Observations = 4 
 Blind Sample ID = M244  Mean = 147.62 
 % Relative Standard Deviation = 8.6 
 Number of Observations = 4 
 Blind Sample ID = M242  Mean = 134.94 
 % Relative Standard Deviation = 6.3 
 Number of Observations = 4 
 Blind Sample ID = M240  Mean = 279.25 
 % Relative Standard Deviation = 10.3 
 Number of Observations = 8 
 Blind Sample ID = M238  Mean = 375.31 
 % Relative Standard Deviation = 7.0 
 Number of Observations = 6 
 Blind Sample ID = M236  Mean = 138.76 
 % Relative Standard Deviation = 8.3 
 Number of Observations = 6 
 Blind Sample ID = M234  Mean = 269.09 
 % Relative Standard Deviation = 4.0 
 Number of Observations = 12 
 Blind Sample ID = M232  Mean = 149.78 
 % Relative Standard Deviation = 3.4 
 Number of Observations = 12 
 Blind Sample ID = M230  Mean = 106.05 
 % Relative Standard Deviation = 6.0 
 Number of Observations = 6 
 Blind Sample ID = M228  Mean = 129.95 
 % Relative Standard Deviation = 3.1 
 Number of Observations = 12 
 Blind Sample ID = M226  Mean = 63.76 
 % Relative Standard Deviation = 11.1 
 Number of Observations = 6 
 Blind Sample ID = M224  Mean = 90.82 
 % Relative Standard Deviation = 6.6 
 Number of Observations = 5 
 Blind Sample ID = M222  Mean = 125.69 
 % Relative Standard Deviation = 5.7 
 Number of Observations = 8 
 Blind Sample ID = M220  Mean = 487.06 
 % Relative Standard Deviation = 2.3 
 Number of Observations = 8 
 Blind Sample ID = M218  Mean = 226.95 
 % Relative Standard Deviation = 1.9 
 Number of Observations = 4 
 Blind Sample ID = M214
The SGPlot Procedure